GIS Services / Remote Sensing
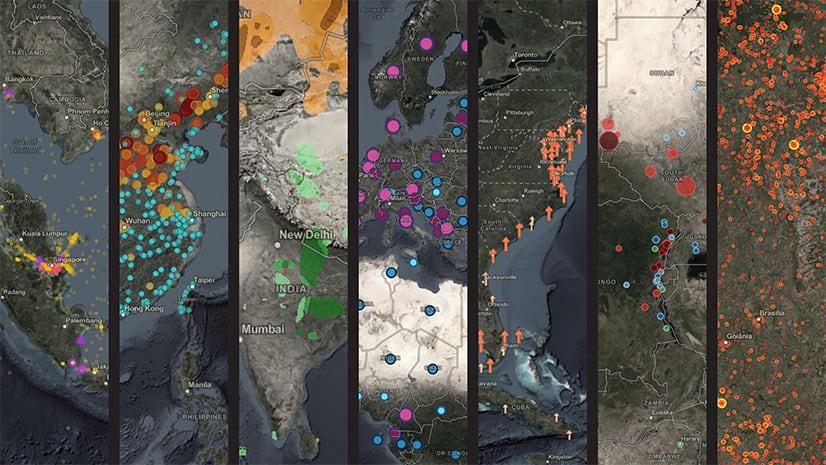
Geographic Information Systems (GIS) and Remote Sensing services involve the acquisition, processing, analysis, and dissemination of geospatial data derived from satellite, aerial, and ground-based sensors. Roamonix delivers high-resolution 2D cartographic datasets across multiple map scales in compliance with international geospatial standards. Spatial engineering workflows are implemented to support decision-support systems, infrastructure planning, and spatial intelligence applications. Quality assurance procedures ensure positional accuracy, data integrity, and timely delivery.
Geological Maps
Geological mapping involves the systematic representation of lithological units, structural features, and surface geology within a geospatial framework. Roamonix produces vector-based geological maps with attribute enrichment derived from legacy and topographic sources. GIS-enabled spatial analysis ensures consistency, scalability, and interoperability of datasets. Outputs support geotechnical assessment, land suitability analysis, and environmental evaluation.

Choropleth Maps
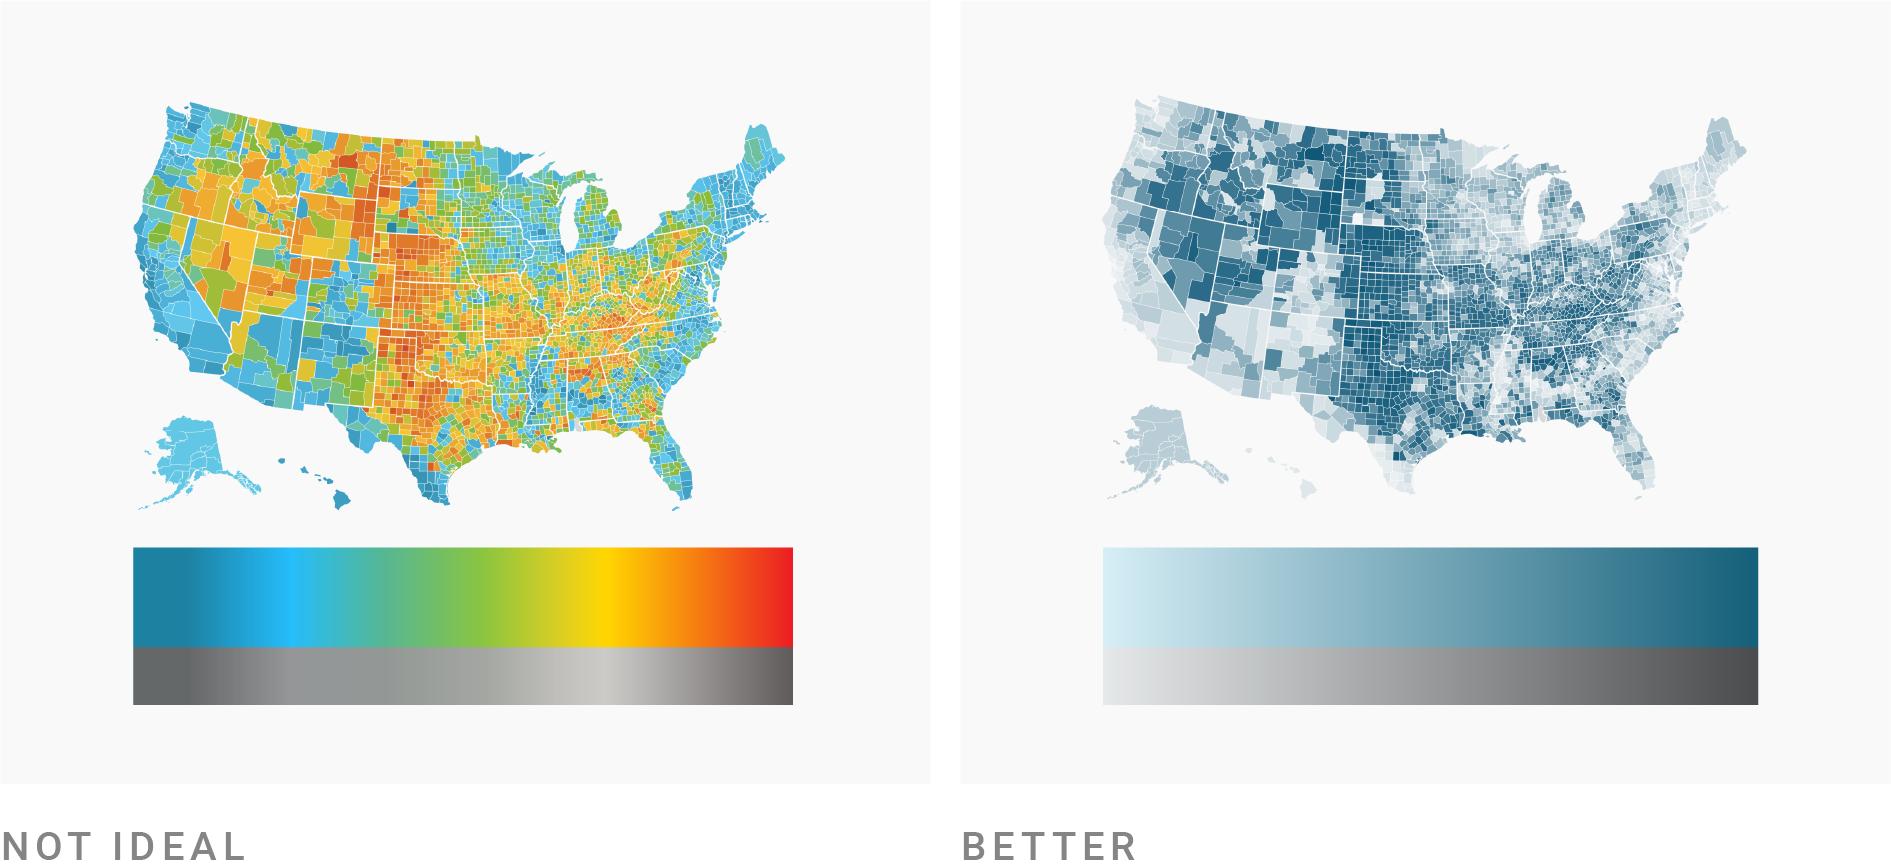
Choropleth mapping is a thematic cartographic technique that represents spatially aggregated quantitative data using classified colour gradients. Data normalization and classification methodologies are applied to ensure statistical validity. These maps enable comparative regional analysis across administrative boundaries. Proper scale selection minimizes spatial bias and misinterpretation.

Cartogram Maps
Cartogram maps apply geometric distortion to spatial units based on quantitative variables while maintaining topological relationships. They are utilized for advanced spatial data visualization and analytical communication. Cartograms highlight relative data magnitude independent of physical geography. Applications include demographic and economic spatial analysis.
Dot Density Maps
Dot density mapping represents spatial distribution through uniform point symbols allocated proportionally to data values. Controlled dot placement algorithms reduce visual clustering bias. These maps are effective for analysing spatial concentration and dispersion. They support demographic, epidemiological, and socio-economic studies.


Flow Maps
Flow maps visualize directional and quantitative movement between spatial nodes. Symbol width and direction encode volume and orientation of flows. These maps support transportation modelling, logistics analysis, and spatial interaction studies. Data accuracy and temporal alignment are critical for analytical reliability.
Graduated Symbol Maps
Symbol geometry and scaling methods adhere to cartographic design standards. These maps facilitate comparative spatial analysis. Common applications include infrastructure, economic, and environmental datasets.

Isopleth / Contour Maps
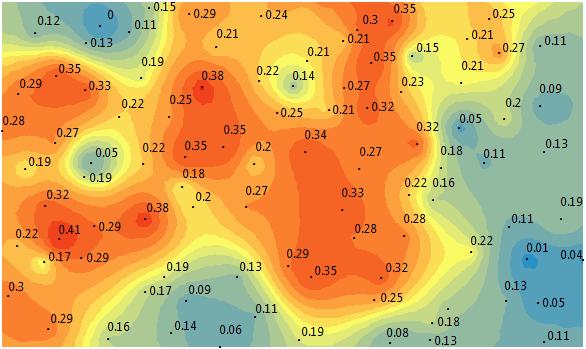
Isopleth maps represent continuous spatial variables through interpolated isolines connecting equal values. Surface generation techniques such as IDW or Kriging are commonly applied. These maps enable visualization of spatial gradients and intensity variation. They are critical for terrain, climate, and environmental modelling.
Network Maps
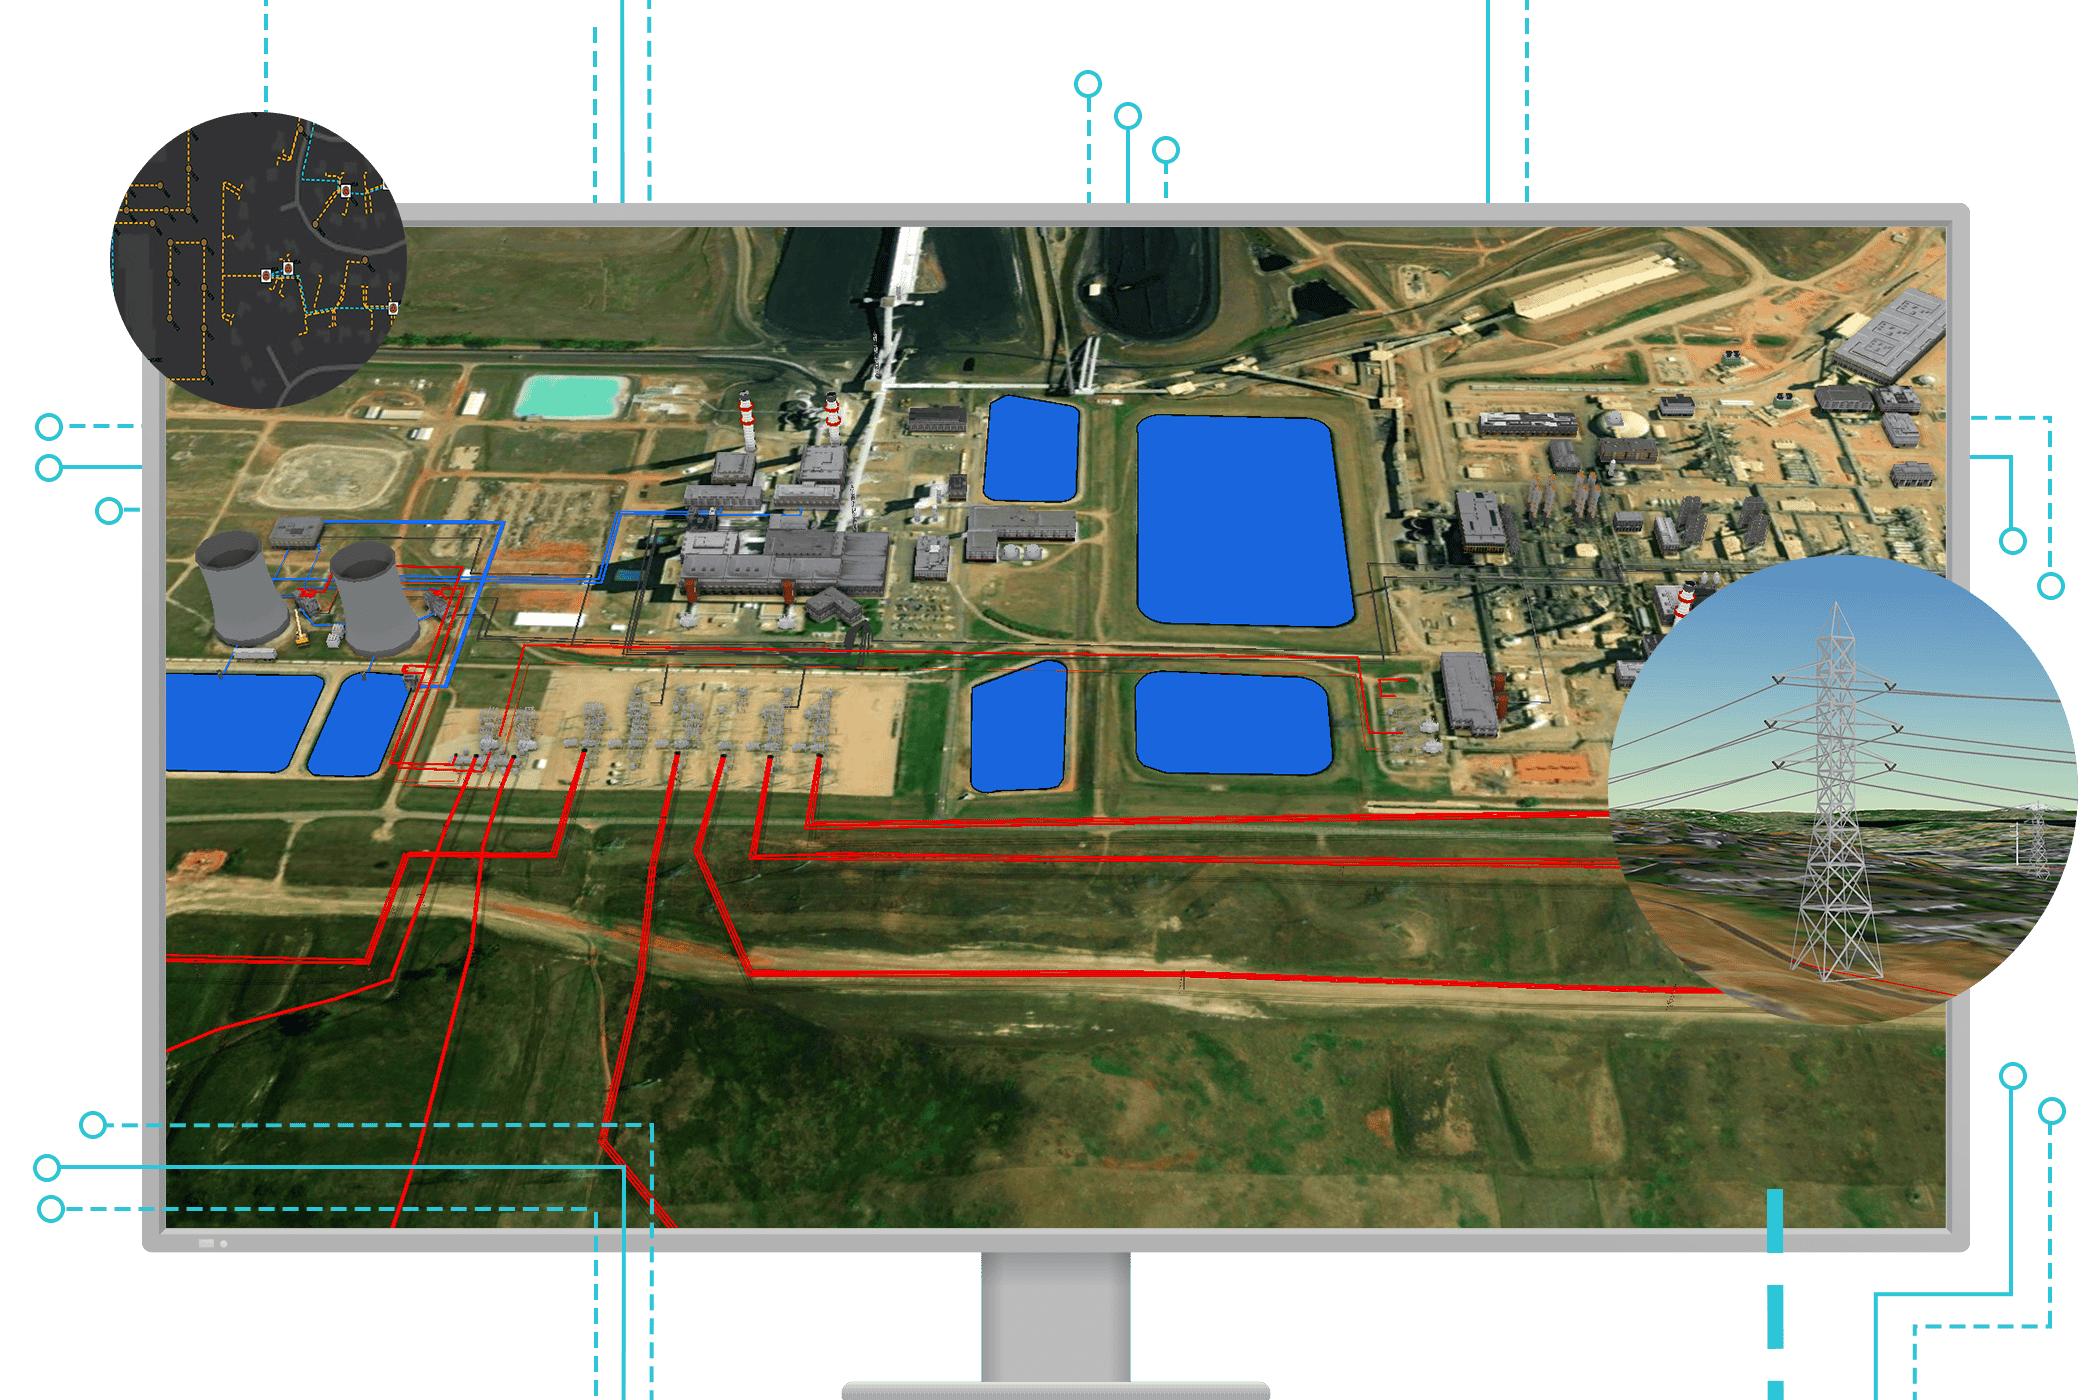
Network maps model spatial systems as interconnected nodes and edges within a graph-based framework. GIS network analysis supports routing, accessibility, and optimization studies. These maps are essential for transportation, utilities, and telecommunications planning. Data topology and connectivity rules govern analytical accuracy.


Thermal Maps / Heat Maps
Thermal or heat maps represent spatial intensity using continuous colour gradients derived from density estimation techniques. Kernel Density Estimation (KDE) is commonly employed to generate surfaces. These maps support hotspot identification and anomaly detection. They are widely used in risk assessment and spatial analytics.
Land Cover Classification
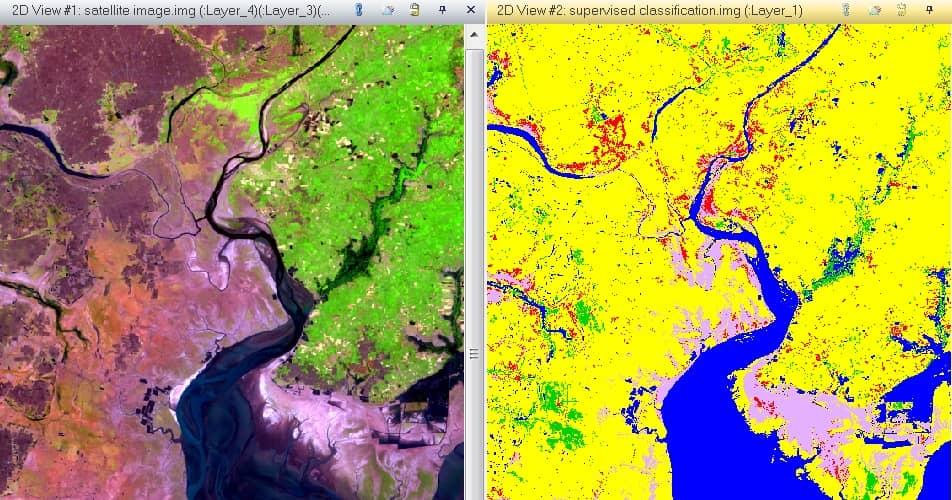
Land cover classification categorizes surface features using multispectral or hyperspectral remote sensing data. Supervised, unsupervised, and object-based classification techniques are applied. Accuracy assessment is conducted using confusion matrices and validation datasets. Outputs support environmental monitoring, land management, and change detection.
Conclusion
GIS and Remote Sensing technologies provide standardized, scalable, and data-driven frameworks for spatial analysis and decision support. They enable precise modelling, monitoring, and visualization across multiple domains. Compliance with international geospatial standards ensures reliability, interoperability, and long-term usability.
We offer a wide range of IT services that guarantee your success